I worry that after all the measures introduced, the real estate tycoon will think they are safe as they are "too big to fail" and continue to balloon the housing markets. This is the result of an era of too dependent on real estate to fuel the economy. The goverment has many tools that can stop the speculation such as introducing tax for second houses or inheritance tax for example but for some reasons, I haven't seen these tools be introduced yet.I agree,in long term transform the economy into consumption driven rather than production driven is important. The property market has sucked too much wealth from Chinese people,no money left for consumption. But for local government,abandon their largest revenue source is hard choice

You are using an out of date browser. It may not display this or other websites correctly.
You should upgrade or use an alternative browser.
You should upgrade or use an alternative browser.
Chinese Economics Thread
- Thread starter Norfolk
- Start date
Yes it's simplified but 3quarters is still quite big part of economy, I think if we wanted more reasonable guess we would need to count what percentage of whole year gdp any quarter of the economy is.@Jiang ZeminFanboy Hold on, I just wanna confirm something. As I understand, you cannot multiply the growth of quarters together if the numbers were taken as year-on-year as that no longer makes them consecutively compared. They are compared to quarters that are 4 quarters prior. You can multiply year-on-year full years because each year is compared to the prior year in a consecutive manner; you can multiply quarter-on-quarter to compare consecutive quarters for the same reason but you cannot multiply quarters together if they were compared on a year-to-year basis. Is this your understanding as well? This is why I don't think the China 3% vs USA 2.4% year on year so far makes sense.
In China case the biggest is the 4th quarter, I guess in the USA would be the same.
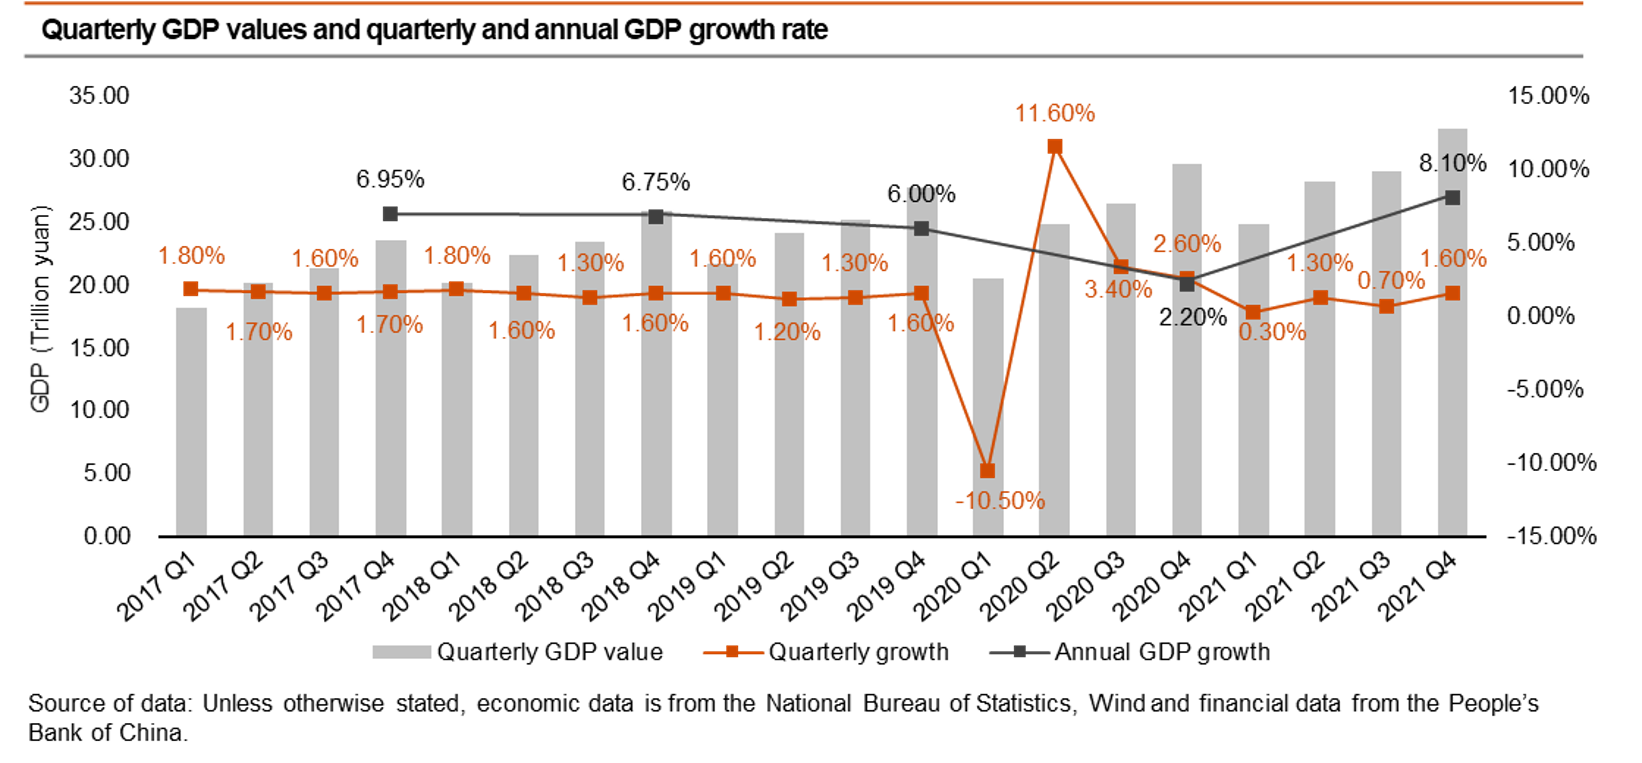
1st quarter is the smallest
2nd and 3rd is similar
4th is the biggest
The funniest thing about him is that he didn't publish the source for the claim he made. Then he changed the direction of the same subject by putting other metrics to prove that the US is still the best, which seems to be a debate tactic of his. Not to mention other statements like mild flu and other nonsense that I even avoid commenting because it is not the subject of the topic.It's not obvious when you don't post your source.
manqiangrexue
Brigadier
No, it's not the size that's the difference; I'm not saying that Q1-Q3 are too small and therefore not comparable to whole years (they are but that's not my point). I'm saying that the logic of multiplying consecutive quarters using year-on-year data is mathematically flawed. For example:Yes it's simplified but 3quarters is still quite big part of economy, I think if we wanted more reasonable guess we would need to count what percentage of whole year gdp any quarter of the economy is.
In China case the biggest is the 4th quarter, I guess in the USA would be the same.
1st quarter is the smallest
2nd and 3rd is similar
4th is the biggest
You have consecutive quarters A1, B1, C1, D1, A2, B2, C2, D2 spanning 2 years.
By a quarter-on-quarter measure, you can derive your relation of B2 to A2 by simply multiplying their growth rates because quarter-on-quarter data is the amount that B2 has grown in comparison to A2, so it makes a complete story.
Now, if you use year-on-year data, you CANNOT multiply A2 and B2 because the given growth rate of B2 was NOT in relation to A2, rather it was to B1! So what sense does it make to multiply A2 and B2 if they have no relationship to each other by the year-on-year measure?
If you wanted to derive the standing of D2 in relation to A1 via quarter-on-quarter growth, you can simply multiply them together. But you wanted to derive the standing of D2 in relation to A1 via year-to-year growth, it would not be possible because year-on-year data gives no relation between quarters that are not separated by precisely 3 other quarters. With year-on-year data, you would only know the relation of D2 to D1 or A2 to A1; A and D would never cross nor any other letters.
Last edited:
Mostly the timing is wrong. Why boosting the property sectors when people are in lockdowns everywhere? And if China could choose anytime for a recession (yes recession is sometime needed to correct the economy), it is now as China has the perfect reasons: Covid-19 and the Ukraine war coupled with global recession worldwide.Ch
China is trying to fix real estate by boosting real estate sector, it's only going to either keep same price or most probably increase prices of real estate .
Well seems like china can't be able to come out from too costly real estate unless taking china into recession .
Wtf are you taking about? I genuinely do not understand the sentence you put together.Well seems like china can't be able to come out from too costly real estate unless taking china into recession .
supercat
Colonel
Tunnel boring machines have been exported to more than 30 countries.
Huge trade surplus for China - however, Chinese policymakers have no intention to make a marked appreciation of RMB for now. Let's wait for the birth of petroyuan after Xi's visit to Saudi Arabia and the Arab-China Summit in December.
Huge trade surplus for China - however, Chinese policymakers have no intention to make a marked appreciation of RMB for now. Let's wait for the birth of petroyuan after Xi's visit to Saudi Arabia and the Arab-China Summit in December.
Tunnel boring machines have been exported to more than 30 countries.
Huge trade surplus for China - however, Chinese policymakers have no intention to make a marked appreciation of RMB for now. Let's wait for the birth of petroyuan after Xi's visit to Saudi Arabia and the Arab-China Summit in December.
Why do you want to filter out oil and iron ore? To insinuate that China being mercantilist by exporting tons of manufacturing goods to the "rest of the world?" For one thing, China doesn't have enough oil and iron ore and it has to pay for those imports, the only way to pay for them is by utilizing the resource it has in abundance: labor and human capital. What is wrong with that? And, if you want to drive your point even further, why don't you also filter out semiconductor import, by far the largest import for China?
In fact, you can't just filter out oil, iron ore or semiconductor and only keep the export, because much of them go into the export goods. If you take them out, Chinese export will collapse to a much smaller scale, therefore defeating your point.
I guess you don't have a point to begin with.
supercat
Colonel
Russia, China set to create payment system without using SWIFT — Deputy PM
Alexander Novak recalled that payments under contracts for gas supplies from Russia to China are already switching to the national currencies of the two countries